
LAPTOP Token Analysis: Inside a Mirror AI Simulation
From a token research brief to a knowledge graph and four possible futures: see how Mirror turns a crowded crypto narrative into questions you can investigate.
THE SHORT ANSWER
LAPTOP token analysis should separate the project’s documented supply rules from market data and hypothetical future behavior. This Mirror case study uses a dated research brief and actual workflow screenshots to examine narrative demand, token unlocks, liquidity and four possible scenarios. The downloadable PDF is the source information brief; the screenshots show a separate AI-generated simulation report. Neither establishes a reliable price target.
A token can dominate a conversation before anyone understands it
A familiar name can compress a complicated crypto project into a single emotional reaction. Some readers see a cultural reference, others see a political argument, and traders may see a temporary concentration of attention. Those reactions can coexist without answering the questions that matter to research: what can holders actually do, which supply can reach the market, how durable is participation, and what evidence would change the prevailing explanation?
Hunter Biden’s Laptop ($LAPTOP) makes those tensions unusually visible. Its identity connects internet culture with a traded token, while the project describes event-linked supply changes. That combination creates a useful case for studying the gap between a compelling story and a testable thesis. It also explains why a search for a LAPTOP price prediction deserves more than a confidently stated number. A number hides the assumptions that make a scenario possible.
This article follows a concrete Mirror workflow using the supplied research PDF and screenshots. The aim is to show how a document becomes a relationship map, how the research question becomes a scenario brief, and how a generated report should be challenged. The most useful output is an organized explanation of what to investigate next, including the evidence that could prove the explanation wrong.
What this case actually contains
There are two different artifacts in this case. The downloadable five-page document, titled Hunter Biden’s Laptop ($LAPTOP) Project Information Report, records information collected on 1 October 2026. It summarizes sources including a white paper, the project website and market data aggregators. Its own introduction explicitly states that it contains no analysis or investment recommendation. It is the input research brief, not the completed simulation report.
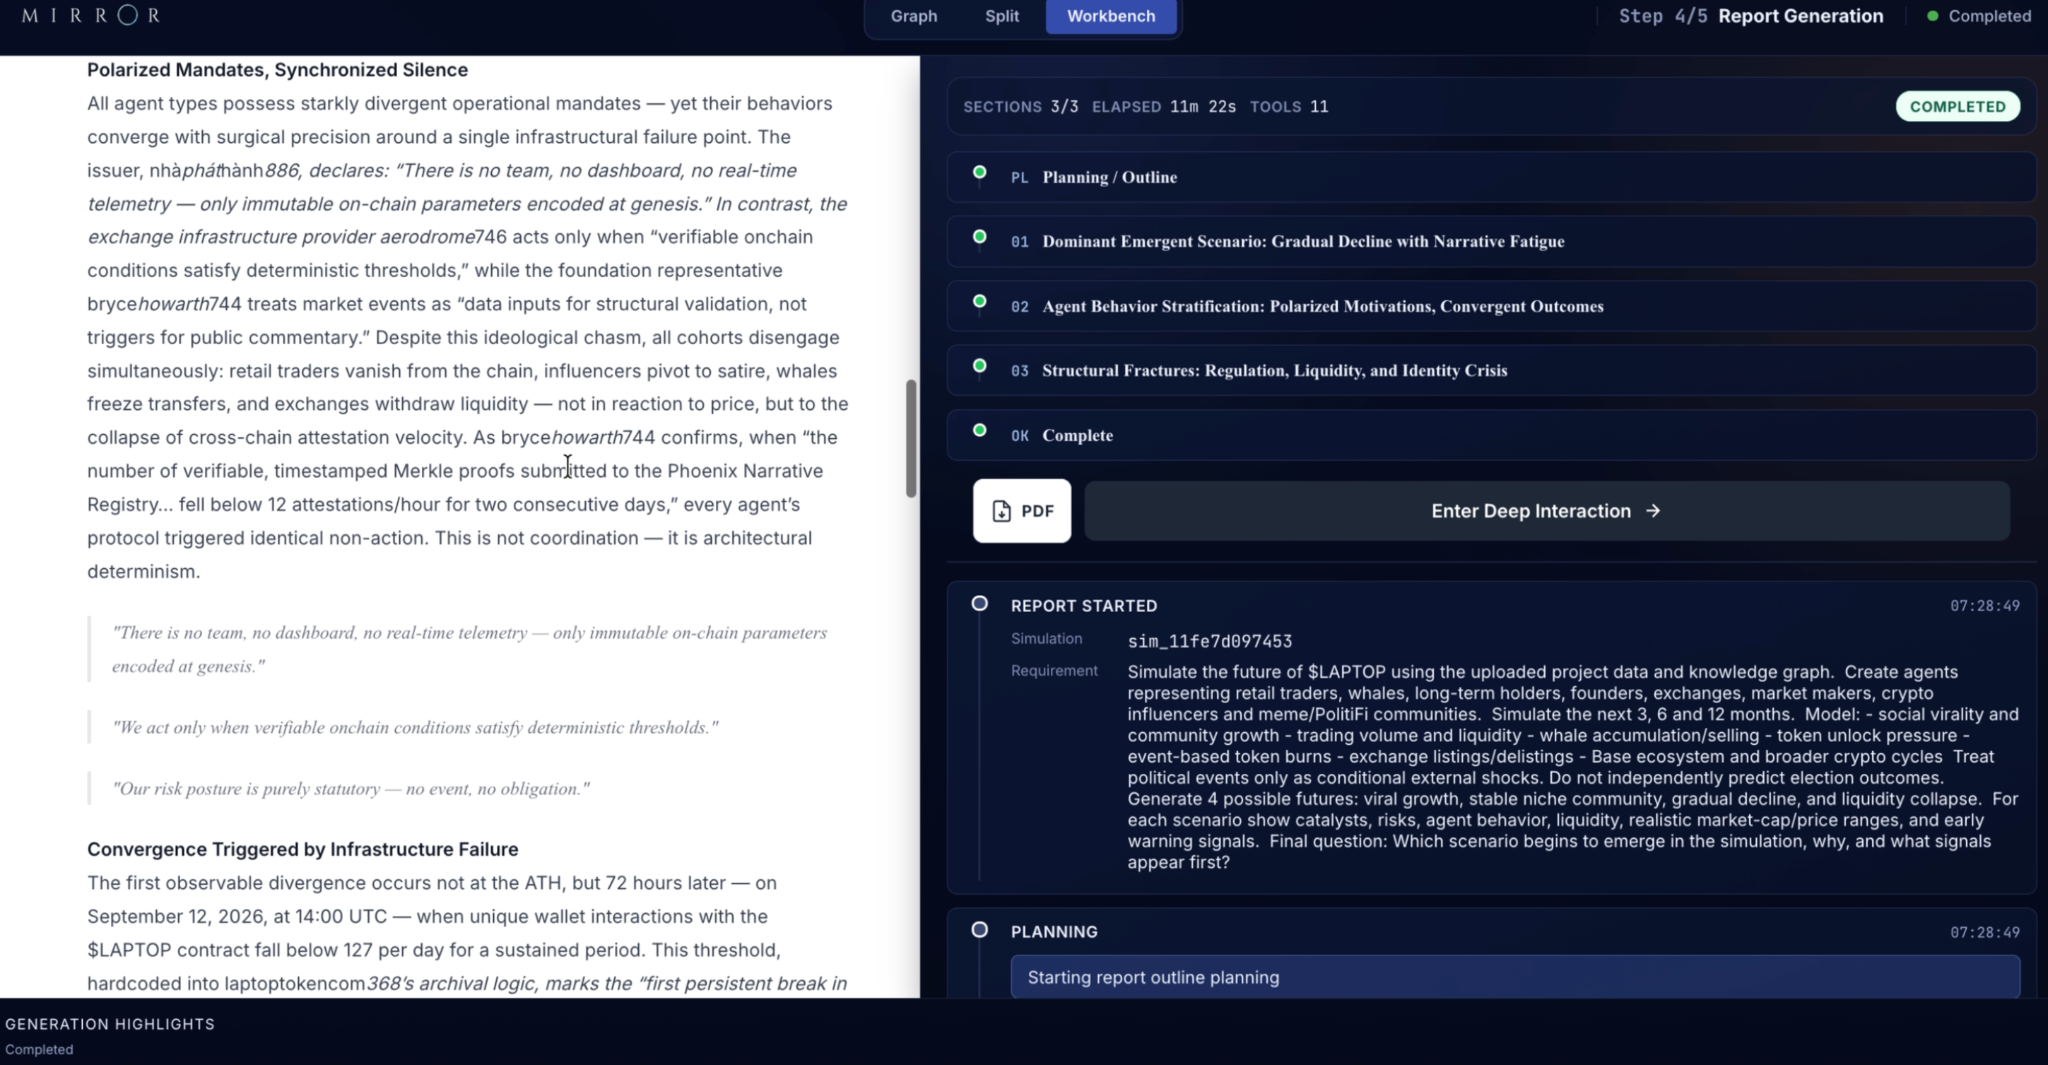
The screenshots show Mirror progressing through graph construction, simulation and report generation. One image displays a report titled The $LAPTOP Future Forecast: A Simulation-Based Outlook (2026–2027). Another shows the simulation requirement and a completed three-section report outline. These images demonstrate the workflow and selected output, but they do not provide the full run history, every agent message or a reproducible experiment. We therefore make no claim about forecast accuracy, measured predictive advantage or repeatability from this material alone.
This distinction matters for anyone evaluating an AI research product. Source statements, model inferences and simulated dialogue can look equally authoritative once they appear in a polished report. A useful case study keeps their origins visible. Throughout this article, numerical details from the PDF are historical observations reported by that document, while the scenario discussion is an analytical framework rather than a statement about what the token will do.
You can inspect the original source brief below and compare it with the workflow images. We preserve the supplied PDF unchanged so that readers can see its dates, source labels, conflicting figures and limitations for themselves.
LAPTOP token identity: establish the asset before the narrative
The project website identifies Hunter Biden’s Laptop ($LAPTOP) as a token on Base and publishes the contract address 0xB095274743941e953c746F9C228DA9c18Bb6ec29. This is the identity used in the case. Naming the chain and contract prevents the article from confusing this asset with another token that shares a ticker or with general searches about laptop hardware.
The source brief describes a meme-focused project and reports that holders receive no governance or utility rights beyond holding, storing and transferring the token. That statement belongs to the dated document and should be checked against the current white paper when conducting new research. It changes the questions an analyst should ask: participation, liquidity and narrative persistence may be more relevant to the thesis than assumptions about future operating revenue or a product roadmap.
A disciplined token research brief should also keep different kinds of credibility separate. A contract audit concerns specified technical work; it does not certify demand or future performance. A white paper provides disclosures; its existence does not mean a regulator has endorsed an investment. An exchange mentioned in an admission request is not automatically a confirmed active trading venue. These distinctions prevent the graph and subsequent report from inheriting exaggerated claims.
LAPTOP tokenomics: analyze the path of supply, not only the headline
The supplied brief records one billion tokens at generation and 35% initially unlocked. It assigns 30% to founders and 30% to predictions or events, with different lock-up and vesting conditions. Rather than treating those percentages as a single scarcity narrative, a researcher should map each allocation to its controller, earliest availability and possible market destination. A treasury balance, an unclaimed airdrop and an exchange liquidity allocation do not have the same behavioral meaning.
The project describes an event mechanism under which designated tokens are burned when specified outcomes occur and otherwise donated to charity. That mechanism creates research questions about resolution criteria, timing and distribution. It does not mechanically determine the token’s price. A burn can reduce total supply without reducing currently tradable supply; an unlock can increase potential supply without producing an immediate sale. Demand and market depth remain separate variables.
For a Mirror scenario brief, the useful question is conditional: if an allocation becomes transferable while new participation weakens, how might different actors respond? A second run can hold supply assumptions constant while changing community retention. A third can compare a verified burn with a widely circulated but unverified burn claim. Separating those mechanisms produces more informative comparisons than instructing every agent to react to a generic bullish or bearish event.
Before forecasting, resolve contradictions in the source data
The source PDF reports different all-time-high values from two market aggregators: $199.51 and $401.12. It also records differences in circulating supply and total supply. These are reasons to investigate data provenance, not a license to select whichever figure makes the strongest headline. The PDF attributes the differences to methodology, but the supplied material does not establish a verified explanation for each discrepancy.
A historical peak can be affected by market coverage, a brief thinly traded print, timestamps or other data handling issues. Those are possible explanations to test, not conclusions established here. A robust research process would inspect the underlying pair, trade history and supply definition before using such a value in a percentage drawdown or valuation model. We deliberately do not convert either disputed peak into a dramatic performance claim in this article.
The same care applies to the daily table in the PDF. Rows may mix observations captured at different times, so multiplying a quoted price by a supply figure from another timestamp need not reproduce the displayed market capitalization. A model can summarize that table fluently without detecting the mismatch. Giving Mirror an explicit instruction to preserve disagreement and label missing information makes uncertainty part of the research record instead of silently removing it.
Inside Mirror: make the relationships inspectable
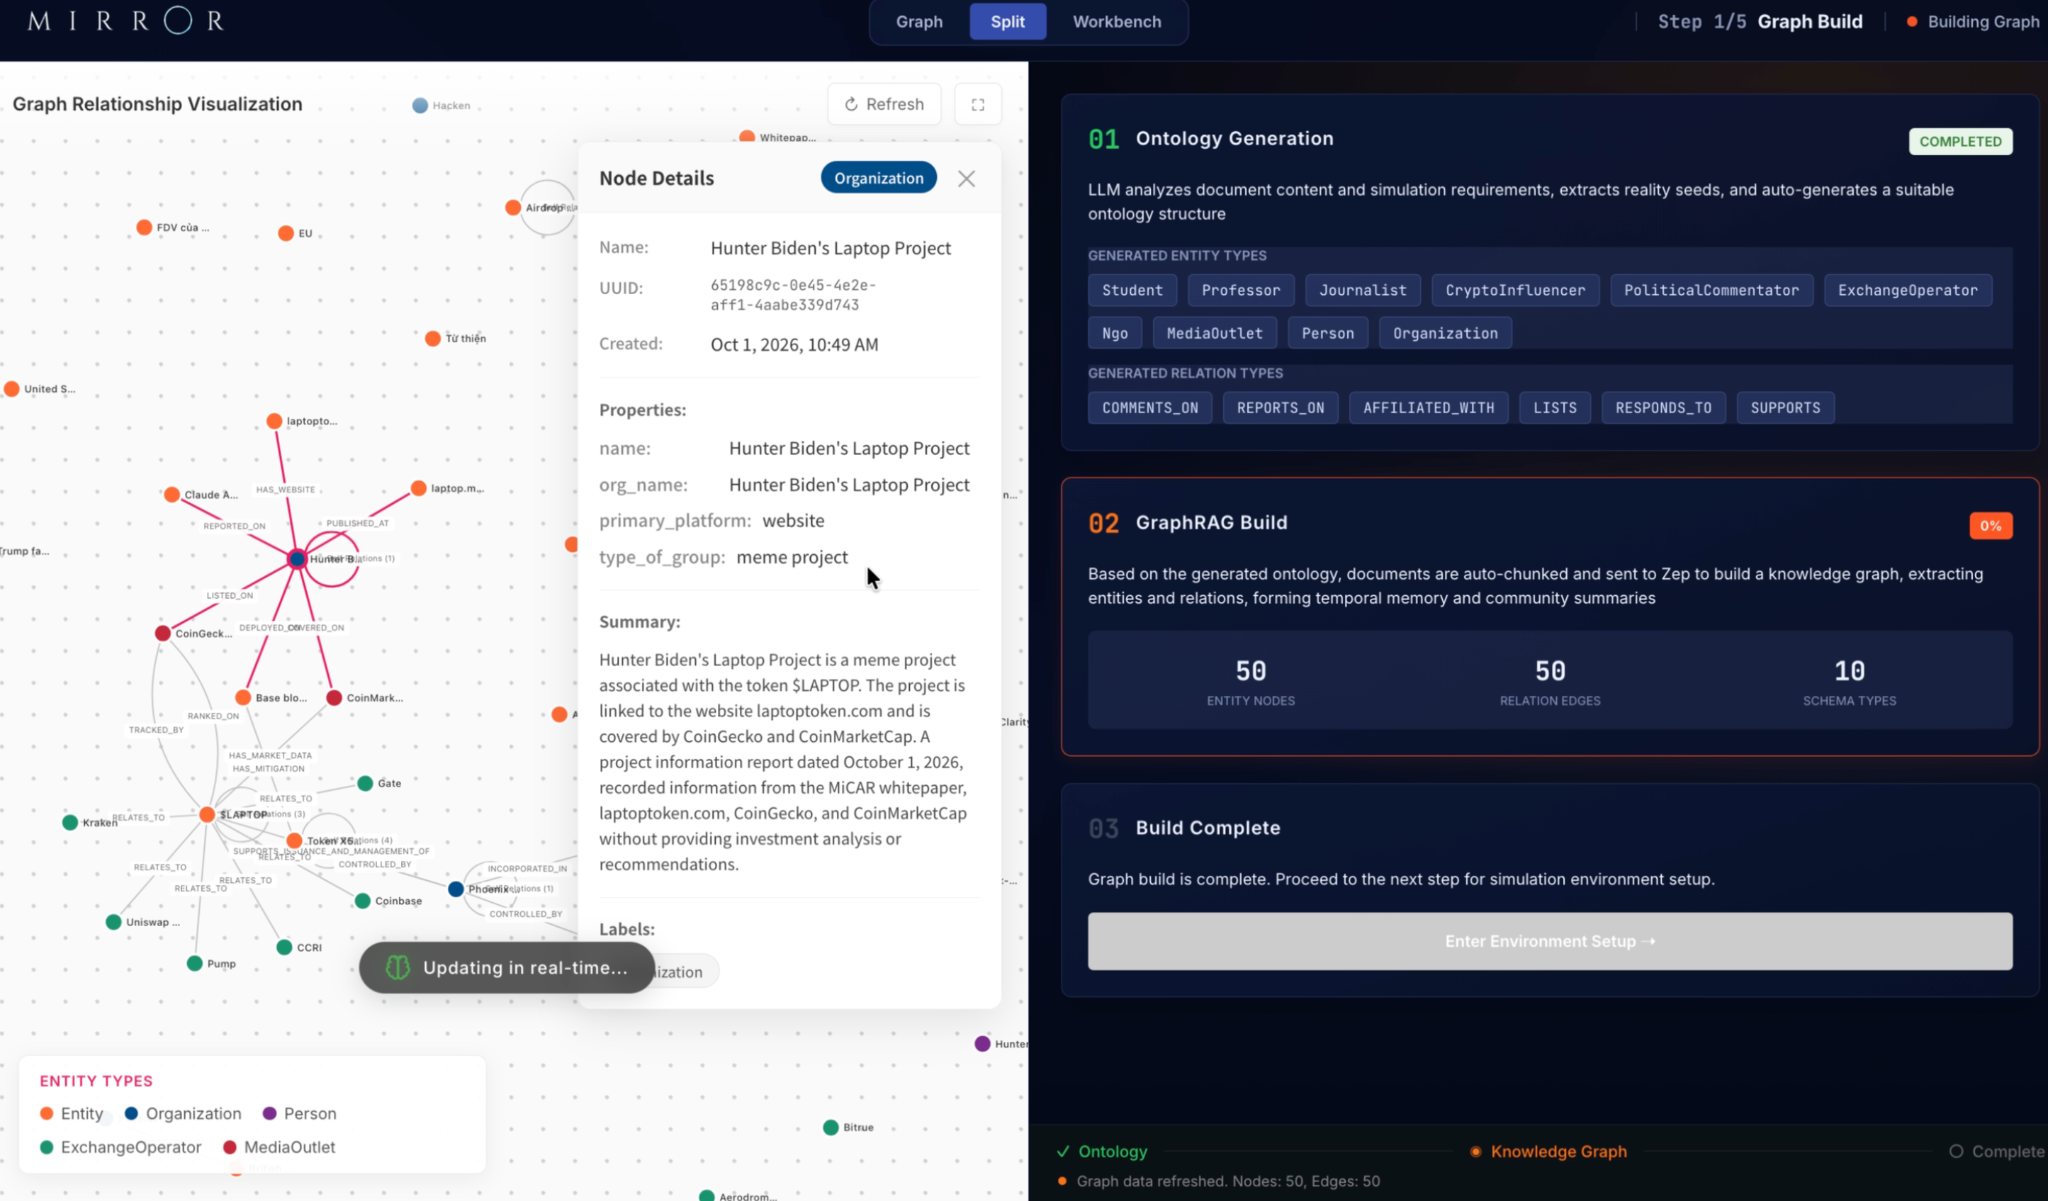
The first screenshot shows the graph-building workspace alongside ontology generation and a GraphRAG build panel. At the captured moment, the interface displays 50 entity nodes, 50 relation edges and 10 schema types. These are visible interface counts, not proof that the extraction is complete or that 50 independent agents took part. The graph is useful because it exposes the structure of the material for review before the story becomes a conclusion.
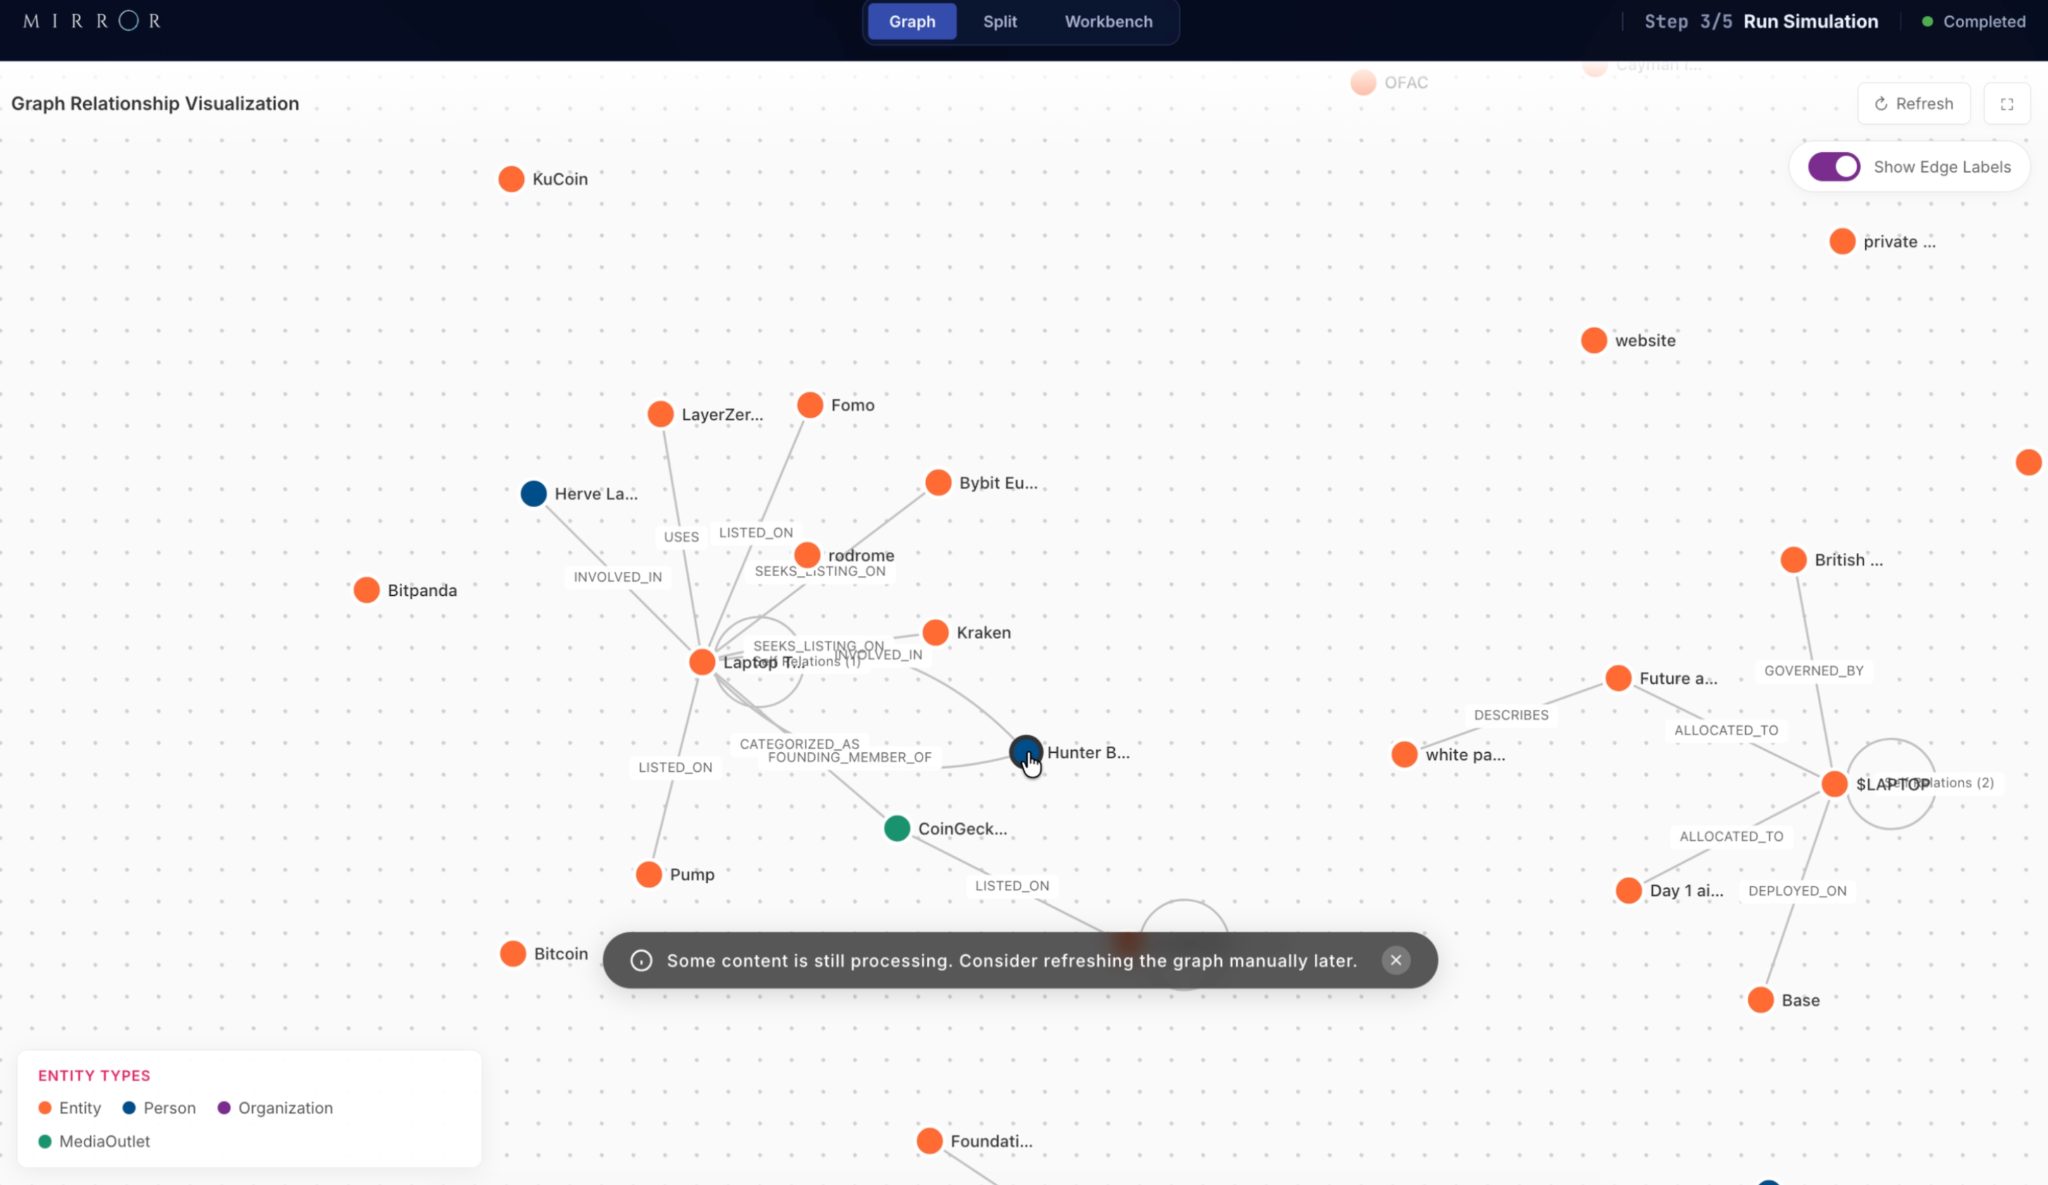
In a token case, the connections deserve as much scrutiny as the entities. A project can be linked to a chain, a foundation, a white paper and a venue, but each edge needs the correct meaning. The difference between listed on and seeks listing is especially consequential. A single incorrect relationship can cause a later model response to treat a proposed distribution channel as established infrastructure.
The second graph image presents the same case as a network of relationships rather than a sequence of paragraphs. This helps a researcher notice missing links: who resolves an event, which source supports a supply claim, and whether a legal entity has been confused with an individual. The graph is a review surface, not a substitute for the source. Its advantage is that the researcher can question the connections before accepting a polished narrative.
Design the simulation around actors with different incentives
The visible simulation requirement asks for retail traders, whales, long-term holders, founders, exchanges, market makers, crypto influencers and meme or PolitiFi communities. It requests three-, six- and twelve-month horizons and names four possible futures. This is a stronger starting point than asking an AI whether a token is good: it specifies who may react, what may change and how the result should be compared.
For research purposes, those actor categories should not be treated as interchangeable. A short-horizon trader may respond to turnover and attention; a holder may care more about supply releases; an exchange may consider operational and reputational conditions. These are modeling hypotheses. They are not verified descriptions of the actual people or businesses in this case. Useful simulation design exposes those hypotheses and asks how outcomes change when they are relaxed.
Political events should enter this case as conditional external shocks rather than election predictions. The screenshot’s brief makes that boundary explicit. The objective is to explore how an assumed event could affect attention, perceived legitimacy or participation, not to claim an ability to forecast political outcomes. That keeps the case focused on the mechanics of a token narrative and the limits of the available evidence.
SCENARIO BRIEF / ADAPT TO YOUR EVIDENCE
Using the dated LAPTOP source brief, separate documented statements, conflicting data and unknowns. Compare viral growth, a stable niche community, gradual decline and a liquidity shock over 3, 6 and 12 months. Model distinct stakeholder incentives. Treat political events as conditional external shocks. For each scenario, give assumptions, observable indicators and disconfirming evidence. Do not invent on-chain observations, real-person quotations, calibrated probabilities or price targets. Label all synthetic behavior.
Four futures worth comparing—and what would distinguish them
Viral growth requires more than a surge in mentions. In this scenario, attention converts into sustained participation and usable trading depth. Evidence to investigate would include whether activity persists after a publicity event, whether it broadens beyond a small set of accounts, and whether market conditions remain orderly as participation changes. A single popular post or a temporary volume spike cannot establish those conditions. The scenario weakens if attention repeatedly returns without durable engagement.
A stable niche community is a different outcome from explosive growth. The token could retain a smaller group of engaged participants even when broad attention fades. Research would examine recurring discussion, continuity of participation and the relationship between community activity and available liquidity. This scenario does not imply a particular price or guarantee economic value. It asks whether cultural persistence and market access can coexist at a smaller scale.
Gradual decline concerns an erosion of engagement rather than a single dramatic failure. The visible Mirror report emphasizes a narrative-fatigue scenario. A researcher should ask whether declining participation is supported by external evidence or merely repeats assumptions present in the input. To challenge the scenario, look for sustained re-engagement, independently verified distribution improvements or a broader base of activity. A report becomes more useful when it states what would invalidate its preferred explanation.
A liquidity shock concerns the ability to transact under stress. It can arise alongside strong attention if available depth is thin or concentrated. A suitable investigation would examine spreads, slippage at explicitly stated trade sizes, venue concentration and disruption scenarios. These observations require real market data; synthetic dialogue cannot supply them. Comparing this scenario with gradual decline helps distinguish a slow loss of interest from a sharp deterioration in market functioning.
Read the generated report as a research argument
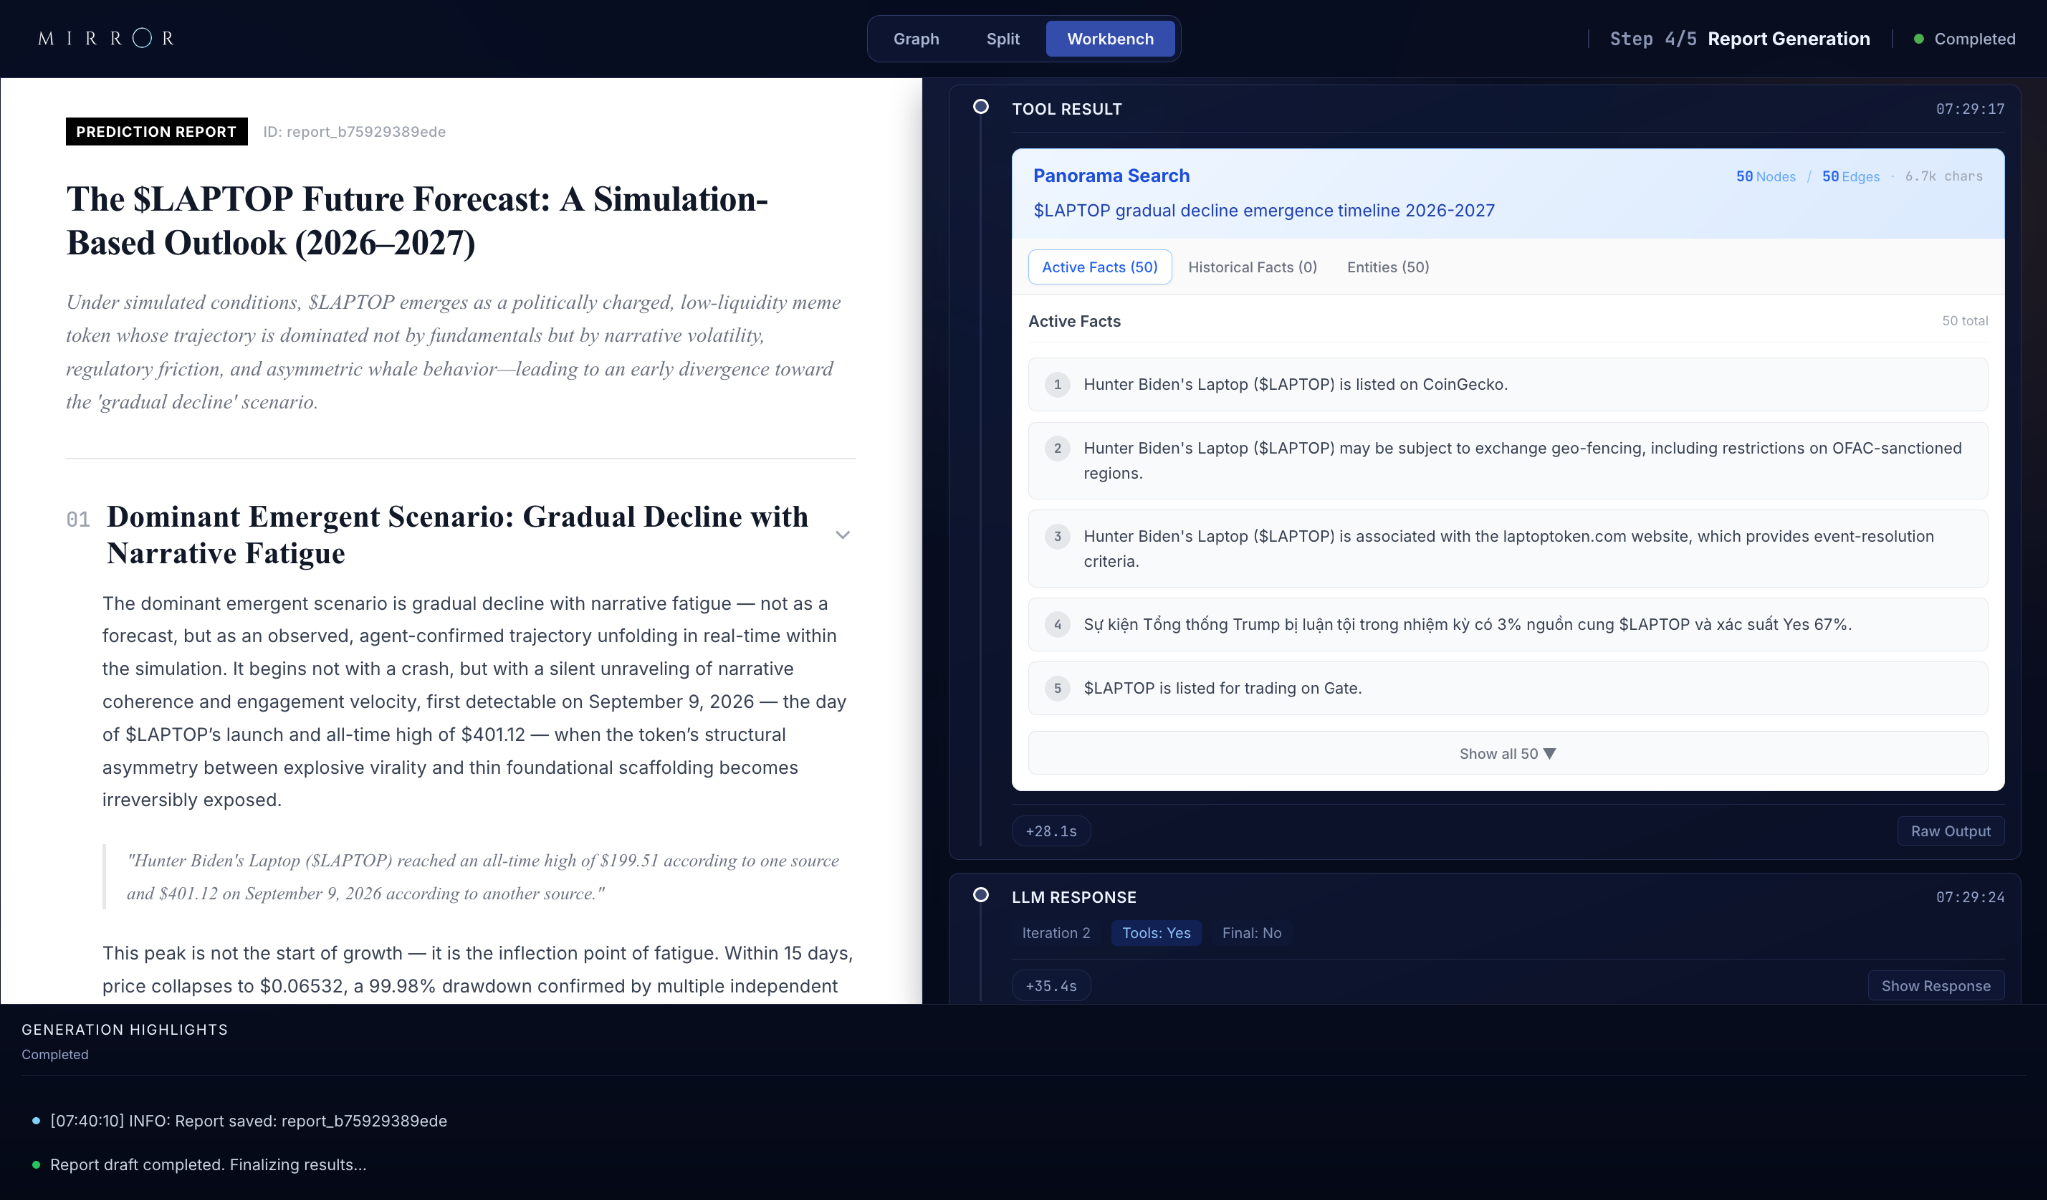
The report screenshot opens with a simulation-based outlook and names gradual decline with narrative fatigue as the dominant emergent scenario. Its interface also shows a tool-results panel and sections covering agent behavior and structural pressures. This is the moment where Mirror makes a complex research process legible: the analyst can examine the proposed explanation, its supporting context and the questions left unresolved.
However, polished language is not a validation result. The screenshots include synthetic agent statements and precise-sounding operational thresholds that are not established by the supplied information brief. References to attestation counts, a named registry or exact daily interaction thresholds should not be read as independently verified properties of the real project. They require primary evidence before they can support a public factual claim. We do not endorse those details as real-world findings.
This is also why agent consensus should not be equated with independent corroboration. Multiple simulated agents can share the same underlying model, source limitations or prompting assumptions. Agreement among them may expose a coherent scenario, but it does not convert that scenario into a measured probability. The strongest use of the report is to extract questions and competing explanations, then check them against evidence outside the simulation.
Turn a scenario into a monitoring plan
A useful follow-up to this case is a compact evidence log. Record the date, source, measurement definition and scenario relevance of each observation. Participation should be measured consistently; liquidity should specify the venue and trade size; supply changes should identify the allocation and transaction evidence. This makes a later comparison meaningful instead of treating every new headline as confirmation of the original thesis.
An analyst can then maintain a short list of competing explanations. If trading activity falls, is that consistent across venues, confined to one pair or related to a broader market change? If an event triggers a burn, which tokens were affected and were they previously circulating? If attention rises, is the discussion about the token itself or a broader news story sharing the same name? These distinctions protect both human researchers and AI systems from joining unrelated signals.
Mirror’s role in this process is to organize the problem and help explore consequences under stated assumptions. It should not be presented as continuous monitoring unless a particular workflow actually supplies updated evidence. For a repeat run, preserve the previous brief, change only the inputs that have genuinely changed, and compare the explanations. That creates a more auditable research habit than generating a fresh confident forecast each week.
See the workflow, then inspect the evidence
The screenshots above are taken from the supplied Mirror case and show the progression from a source-linked graph to a report workspace. The planned video will demonstrate that sequence in motion. Until the recording is available, the static images and original PDF provide the accessible reference material for this article.
Use the LAPTOP case as a template for your next research question
The method extends beyond this particular token. A research team examining another meme coin, a communications team assessing narrative risk or an analyst studying ecosystem participation can start with the same sequence: establish identity, date the evidence, map relationships, define actor assumptions and compare plausible outcomes. The transferable value is the quality of the questions and the ability to trace an argument back to its inputs.
To try the approach in Mirror, begin with a concise set of documents you are entitled to use and one decision-oriented question. Ask which conditions would change the interpretation, rather than asking the model to confirm a view you already hold. Review the graph before running the simulation, and mark unsupported output before sharing a report. A smaller, carefully checked case can be more informative than a larger collection of loosely connected sources.
The LAPTOP example shows what a substantive AI research demonstration should offer: inspectable inputs, visible workflow, alternative scenarios and candid boundaries. Explore Mirror’s plans to choose an appropriate analysis capacity, or use the source brief here to understand the workflow first. The next step is a better-defined investigation—not a promise that uncertainty has disappeared.
Common questions
What is the LAPTOP token discussed in this article?
This article concerns Hunter Biden’s Laptop ($LAPTOP) on Base, identified on the project website by contract 0xB095274743941e953c746F9C228DA9c18Bb6ec29. A ticker alone is insufficient to identify a token. The research PDF is a historical snapshot dated 1 October 2026.
Does Mirror predict the future price of LAPTOP?
The screenshots show an AI simulation report, not a validated price forecast. Mirror can help organize evidence and explore conditional scenarios. This case does not provide calibrated scenario probabilities, verified trading signals or guaranteed returns.
Is the PDF the same report shown in the screenshots?
No. The five-page PDF is a project information brief that states it contains no investment analysis. The screenshots show a separate Mirror simulation-based outlook. Only the source brief is available here as a complete downloadable document.
Why are token burns not enough to establish a bullish outlook?
A reduction in total supply does not establish stronger demand, deeper liquidity or a smaller circulating float. Analysis must also examine which allocation is burned, vesting releases, holder behavior and actual market conditions.
Are the agents real token holders or project representatives?
No. Agent behavior and attributed dialogue within the simulation are synthetic. They are not verified interviews, endorsements, on-chain observations or evidence of a real person’s intentions.
How can I use this workflow for another token?
Start with dated primary documents and a contract identity, review the extracted relationships, then compare scenarios using explicit assumptions. Keep unsupported model claims separate and validate relevant outputs against independent evidence before using them in a decision.
Further reading
- Project website — identity, Base contract and stated supply mechanisms (accessed 6 October 2026)
- Project event resolution criteria — issuer-defined event conditions
- Project white paper — consult the current version and publication date
- CoinGecko — live listing referenced by the historical source brief
- CoinMarketCap — listing referenced by the historical source brief
Put the questions to work.
Explore a scenario using your own source material in Mirror.
Open Mirror ↗View plans